data-visualization-portfolio
Final Project Part II: Storyboard, User research, and Prototype
Part I of the final Project can be found here, to track the progress.
Part III of the final project can be found here
Updated Wireframes & Storyboards
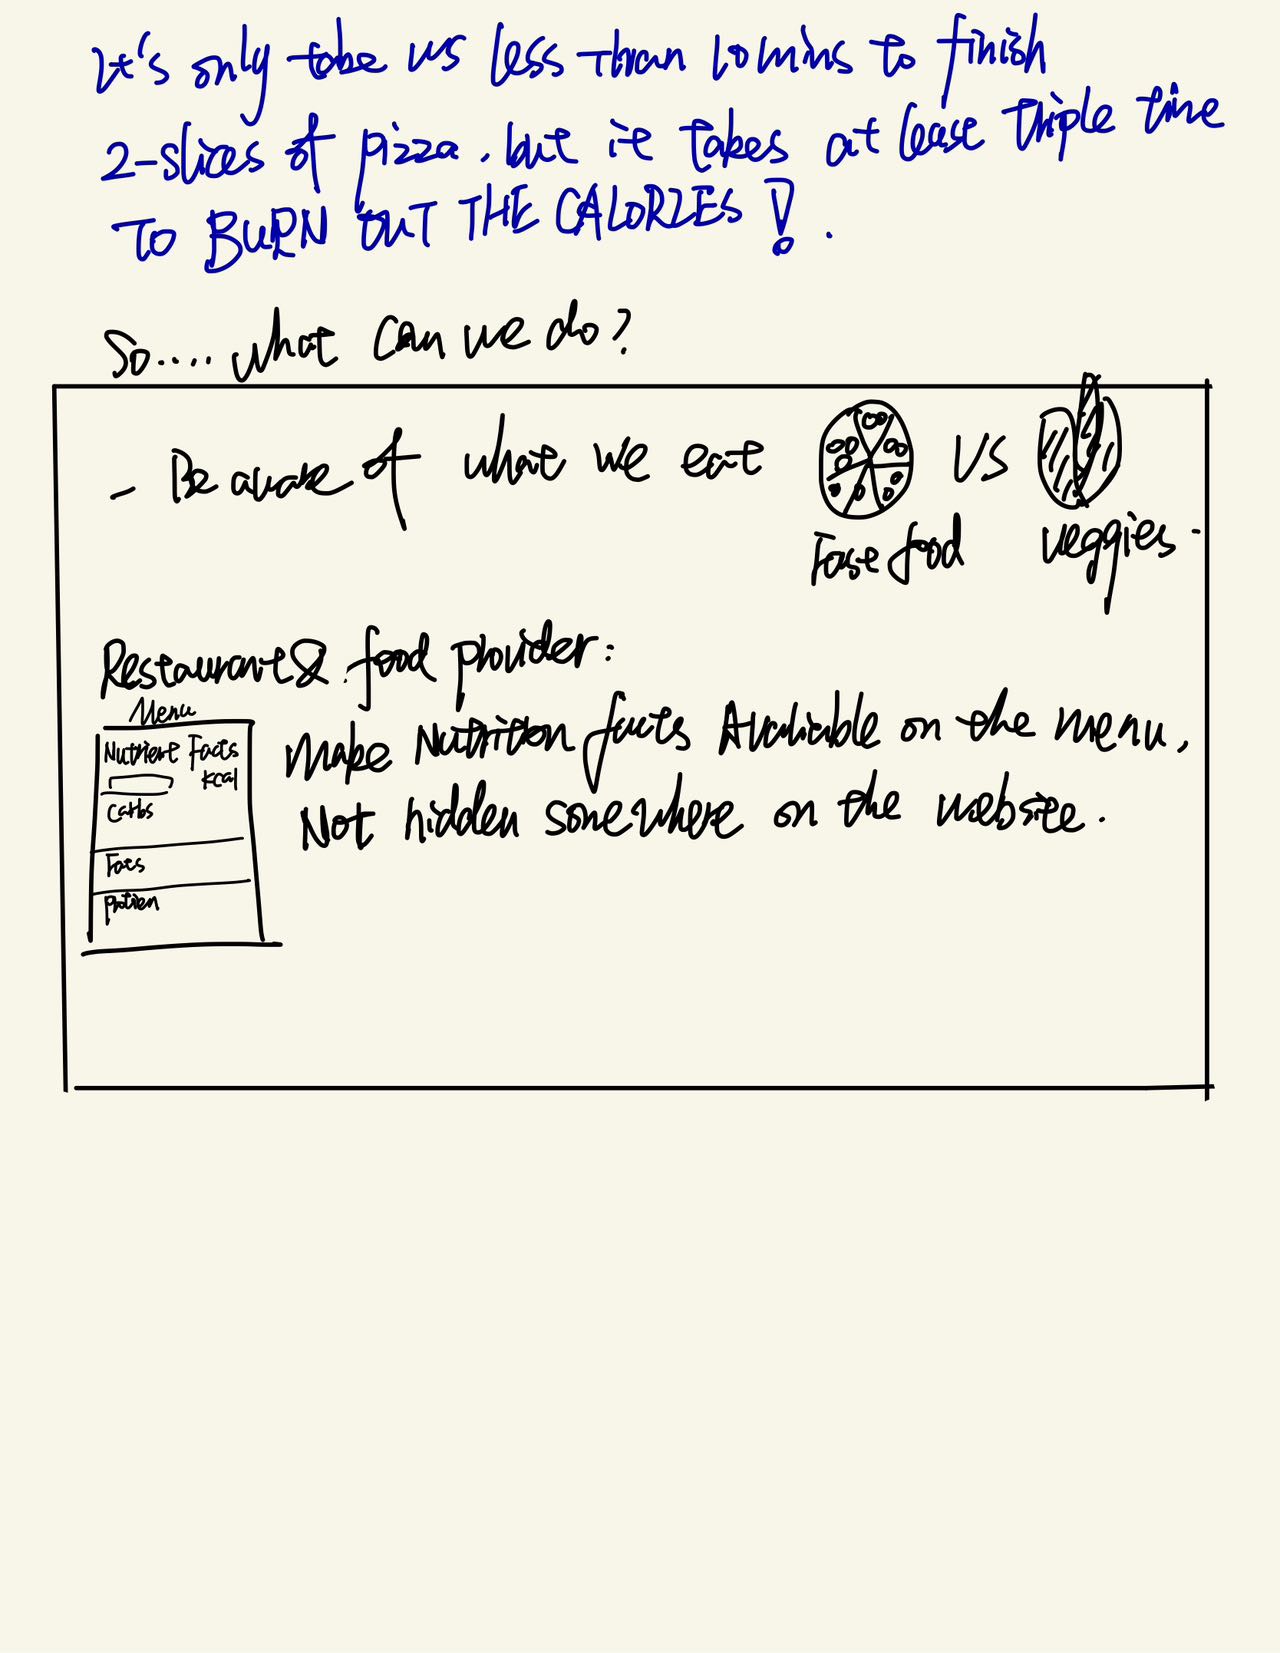
- The following developed wireframes is a updated version from initial sketches in part I of the final project.
- The main developments & improvements are:
- Illustration of audience’s mental journey
- Additions of more visualizations
- Additions of recommendation (call for action) section at the end
- modification based on last week’s critique
the storyboards are used for user research and later pushed in production on shorthand after getting feedbacks.
User Research
user research protocol
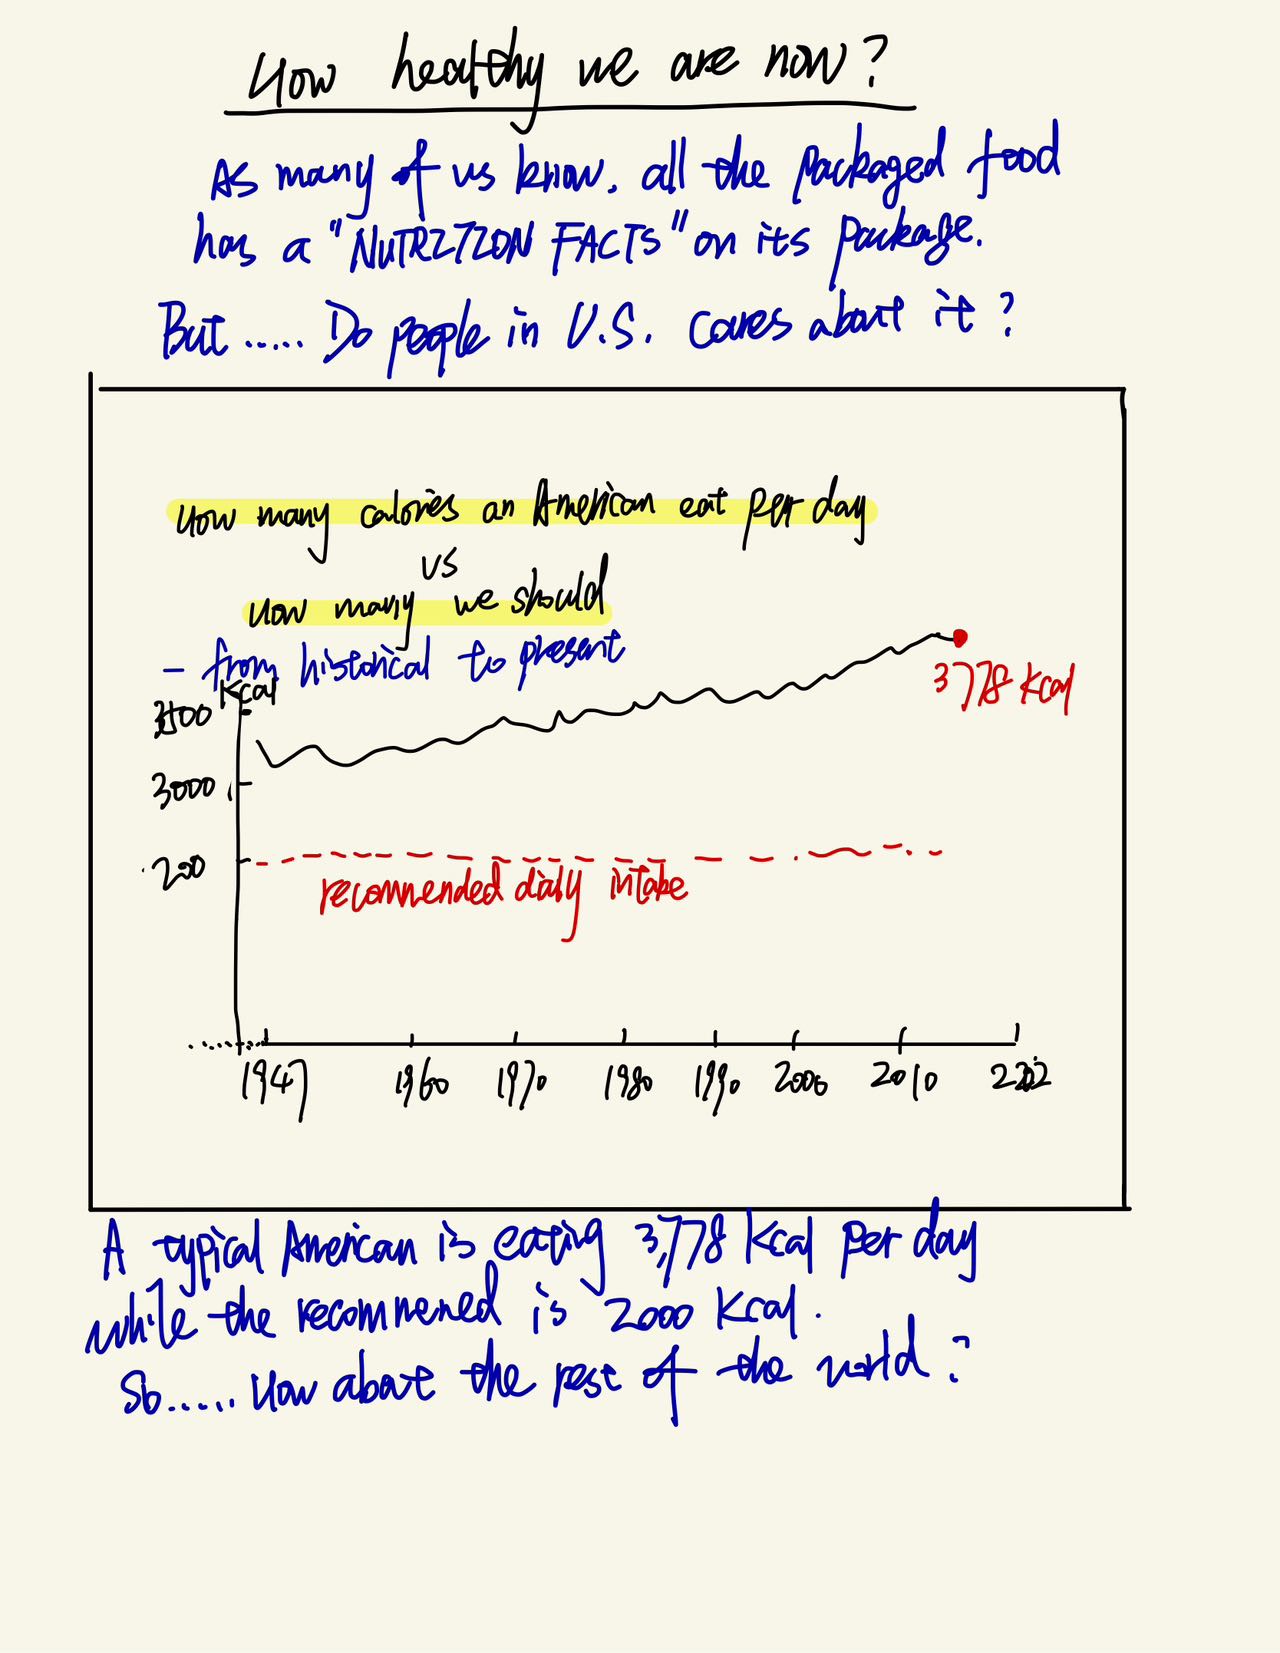
My project focuses on telling the story about how unhealthy food choices available in the U.S. right now, and how people’s eating habits detour from recommended health guide both actively and passively.
the target audience of the story
- Primary audience: the general public in the U.S., specifically those “frequent customers” of fast food brands, who are identified as overweight/obesity.
- Secondary audience: resturant owner/food providers and related stakeholders who can potentially change the landscape of food industry (even make a little difference).
- Additional audience (I wish to reach out): policy makers who can enforce regulation on school lunch supply, resturant nutrition enclosement and anything could help guid people eat healthier.
approach to identifying representative individuals to interview
Since I would target all the people in the U.S., my approach is a comparatively general than that would be used for niche topics.
I planned to interview one friend who I know having a bad eating habits and is less awared about food nutrition than a typical American.
Additional representative individuals were expected to be those who visit the McDonalds on Forbes Ave in Pittsburgh on my interview day.
To keep the interview responses balance, I targeted to interview one individual who has above-average awareness on food health, and actively exercise on a weekly basis as well.
Interview Script & pre-determined interview questions
- Brief introduction: “I am working on a project that aim to tell the facts about the landscape of current eating habits within the U.S. and would like to hear your feedback on it. Any honest opinion is welcomed. It would only take less than 5 minute.”
- Prior to storyboards walkthrough:
- How often do you eat fast food per week?
- Do you consider yourself having a healthy lifestyle, speicifically regarding your food preference?
- Post storyboards walkthrough:
- what impress you the most from the storyboards, or what you would summarize in one sentence?
- What is unclear to you? and what information you would like to explore more?
- Are you motiviated to change your behaviors, even a little bit?
- Wrap-up:
- “Thank you for taking your time! Wish you have a good day and keep healthy!”
the findings from interviews
To prevent enclose PII information, I would provide the summary of positive and negative(area of improvement) from the interview.
- Positives:
- the langauge used is easily to understand (precieved by all 3 interviewees)
- the visualization is not confusing (but not fancy as well)
- one audience expressed impression that she should pay more attention to what she eats on a daily basis and would like to learn more about this topic.
- Negatives:
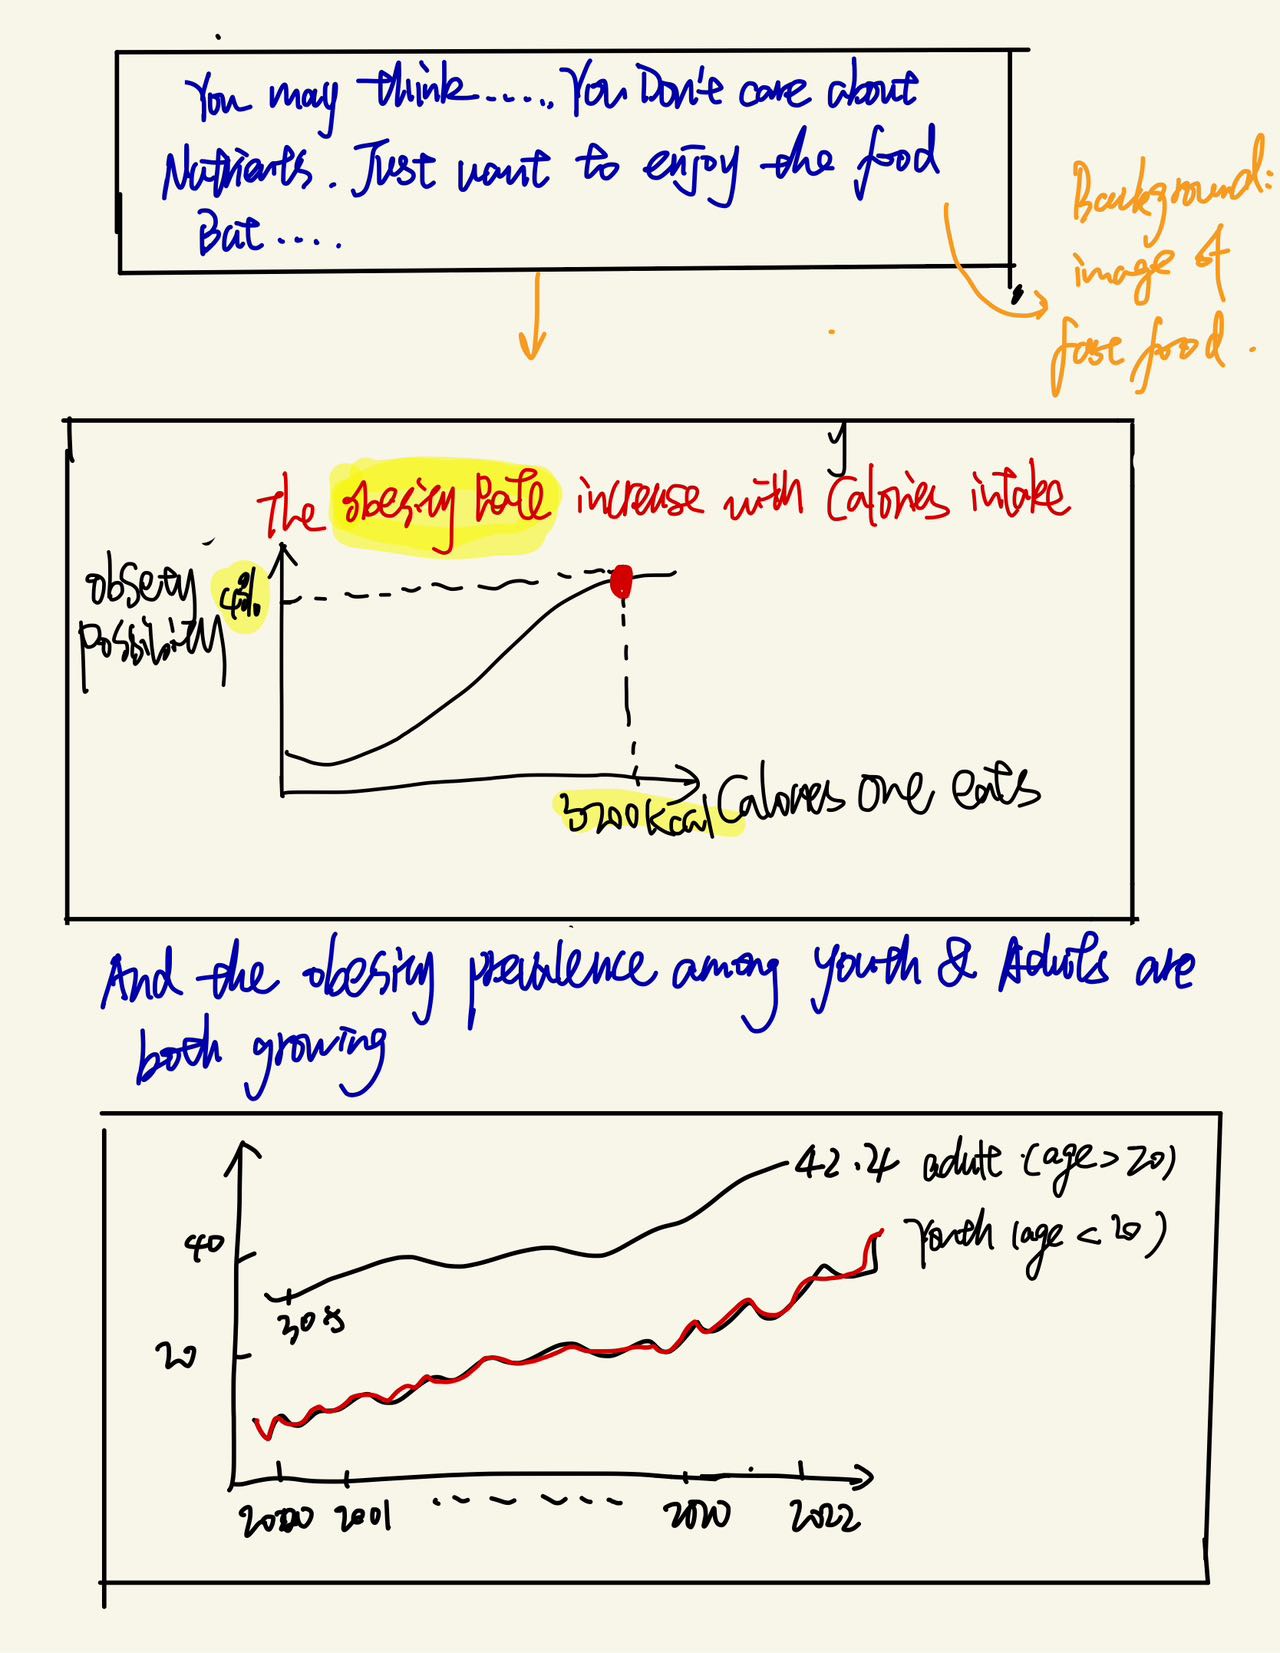
- the interviewee who actually had a lot of background on food health and nutrition shared the concern about if the message from the story would be too scary to some of the audience, for example, those who already experience eating disorder (eat far less than 1000 calories per day). I think this feedback is extremely helpful as I don’t want to influence the audience in a negative way
- “I get your idea but I am so busy to choose among healthy choice and I bet many people could only afford those junk options”
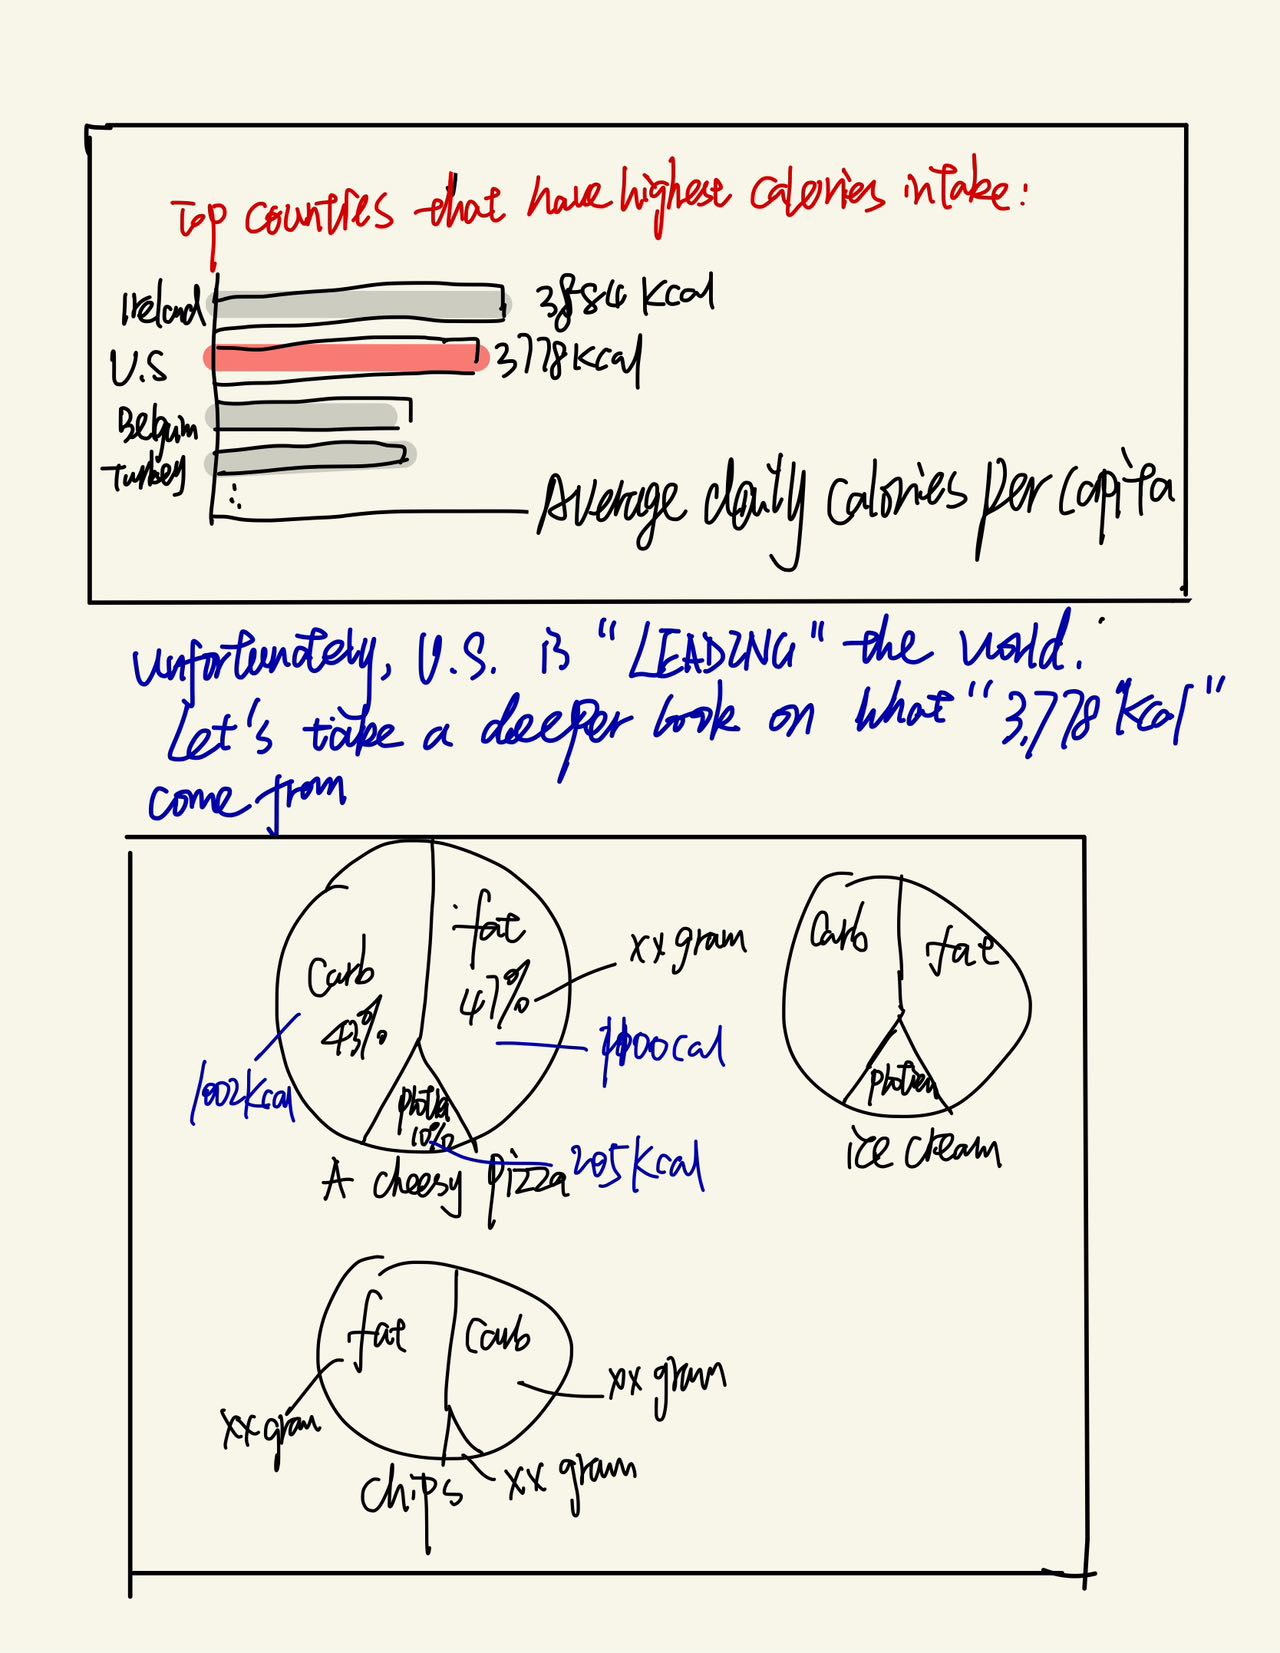
- the pie chart showing calories in a pizza is not too intuitive (how the size of each piece determine, it’s unclear if its percentage or grams)
- The narratives is a little bit too inclined. The interviewee expressed that it seems like some descriptive langauage is exaggerating the problem.
changes planned on implementing to update visualizations next week to address the issues identified
- Additions:
- information provided to provide some affordable yet healthy options to audiences who do want to make a difference
- investigate and include the food health VS. poverty, and make recommendation on that as well
- include the oppsoite side as well (for those experience eating disorders): under-eating is also not healthy! (**important)
- Modifications:
- Pie chart: be clear and consistent on the scale of the data